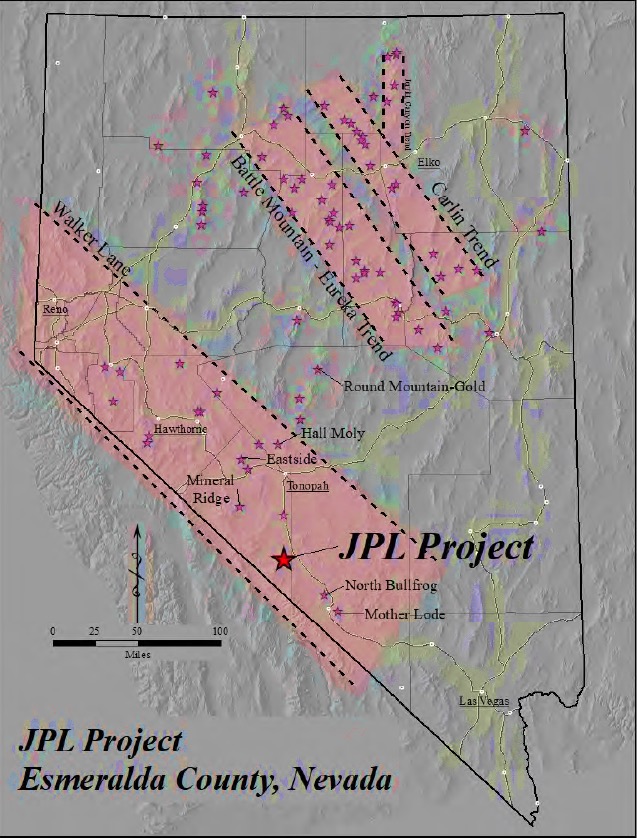
Starmet’s JPL Project is ideally located in Esmerelda County, Nevada, in the southern Walker Lane Mineral Belt within the Gold Point-Tokop Mining District (adjacent to the Carling Trend and the Battle Mountain-Eureka Trend, Figure. 1).
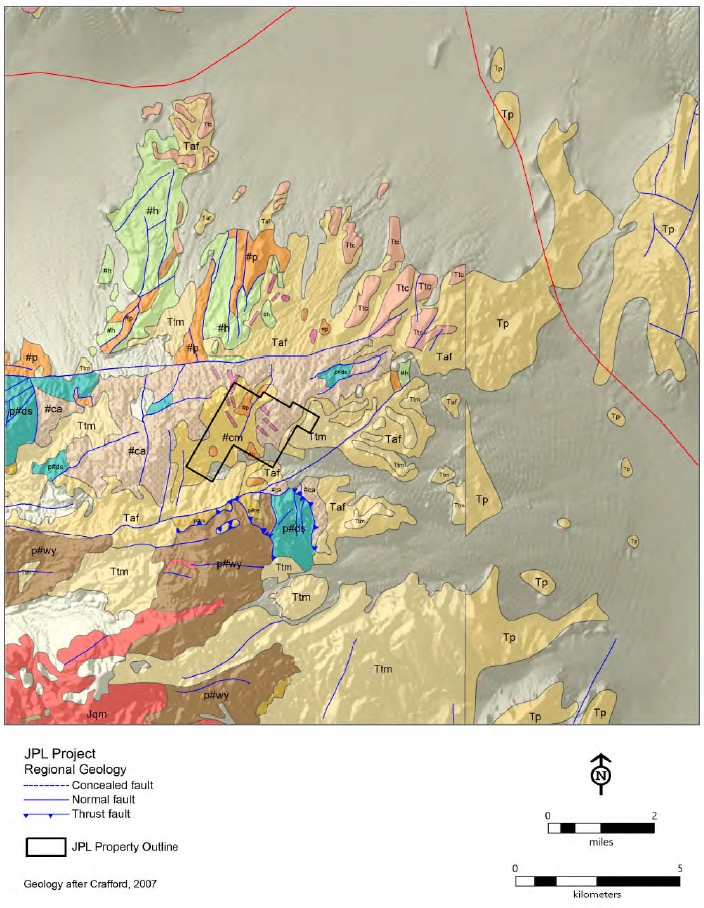
Regionally, the JPL project lies within the Walker Lane deformation zone (a northwest-southeast-trending active tectonic zone with dominantly right lateral and sympathetic cross faults that hosts a variety of precious metal and base metal mineral deposits, as well as geothermal activity along its length, Figure. 2), a distal reflection of the San Andreas plate boundary structure. The Sylvania Pluton underlies most of the Tokop Mining District but lies immediately west of JPL. Lithologies at JPL range in age from late Precambrian to Holocene (Albers and Stewart 1972).
Figure. 2 – JPL Project – Regional Geology
Property Geology
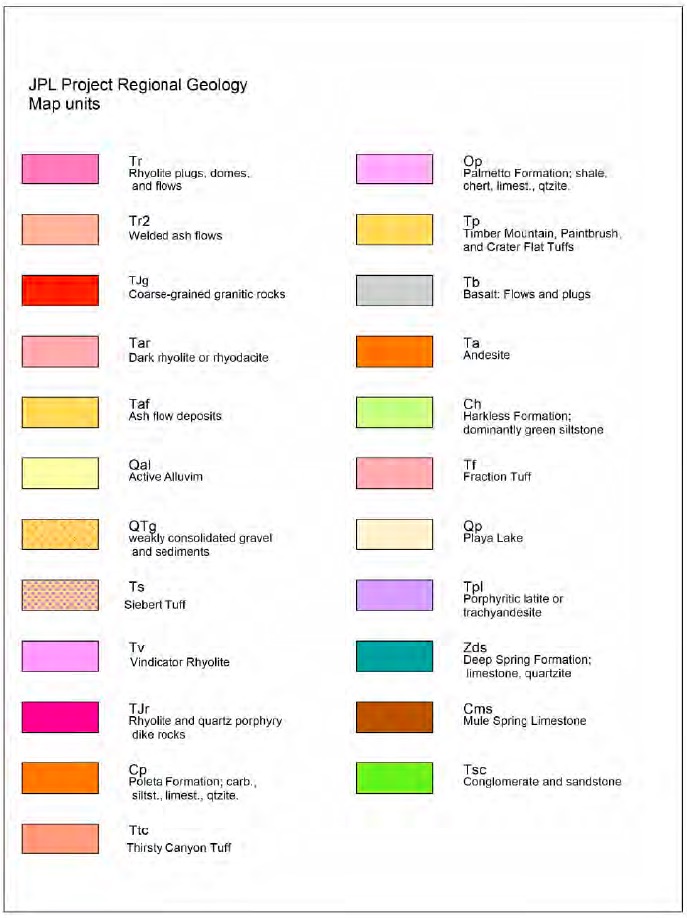
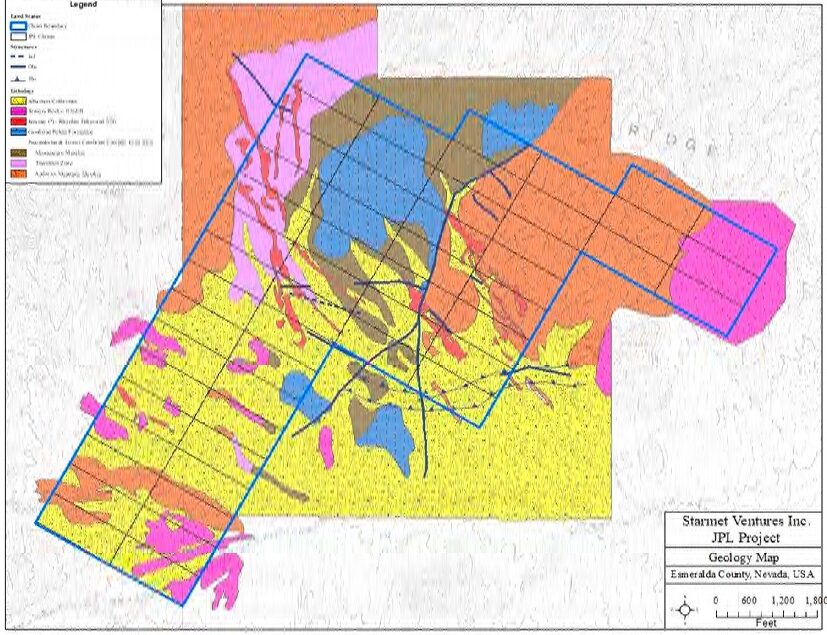
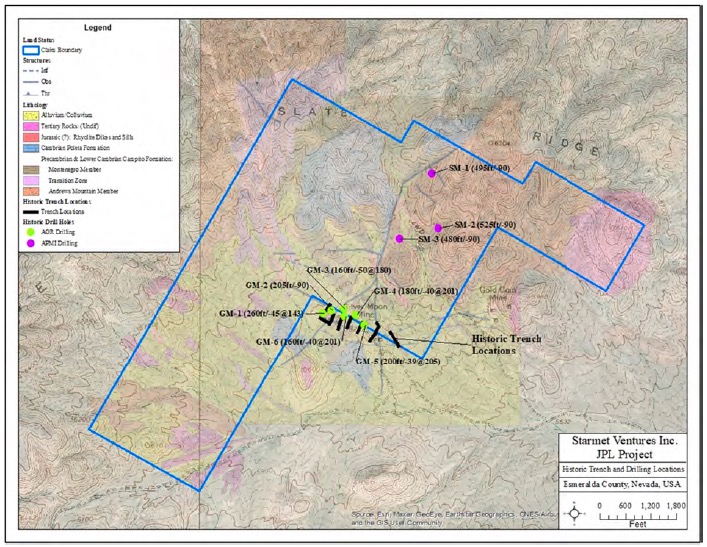
Hunsaker (2021) completed a geologic map covering the entire claim block (Figure. 3). The mapping is based on work by AGR and Atlas compiled in Long, 1997.
The units mapped are the Precambrian to Cambrian Campito Formation, which is broken up into the Montenegro Member and the Andrews Mountain Member. Between the Montenegro and the Andrews Mountain Member there is a unit mapped as the Transition Zone. The Cambrian Poleta Limestone overlies the Precambrian-Cambrian Campito Formation. Jurassic dikes and sills cut both the Campito and Poleta Formations (Figure 18 and Figure 19). The dikes and sills consist of two lithologies: quartz porphyry/rhyolite and latite. Tertiary rocks, comprised of ash flows, lava flows, volcanic breccias, and fresh water sedimentary rocks overlie the Paleozoic metasediments. Alluvium and colluvium are present as valley fill. These units are defined by Albers and Stewart (1972) and Long (1997).
Structural zones at JPL are oriented east-west, northwest-southeast, and northeast-southwest. Dikes and sills at JPL trend northwestsoutheast. Structures that contain gold mineralization that was mined in the historical workings, identified in historic trenching, and drilled in historic reverse circulation (“RC”) drill holes include:
North dipping-low-angle shear zones • Thrust faults • Possible high angle reverse faults Important mineralized structures include: 1. East-west structures 2. Northwest-southeast structure zonesed in historic trenching, and drilled in historic reverse circulation (“RC”) drill holes include:
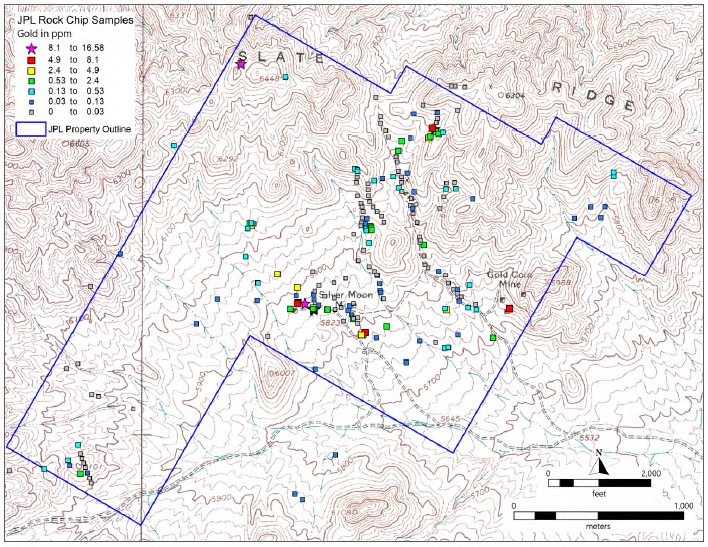
Mineralization discovered to date consists of structurally controlled veins and disseminated sulfides (or their oxidized remnants) in fracture zones. At this point, a coherent mineralized body has not been identified. Surface sampling (including mine workings and dumps), trenching, and drilling have returned gold values up to 16.58 ppm Au with 247 ppm Ag from dumps and 10 samples ranging from 1 to 6.99 ppm Au in trench samples. Several target areas identified by geology, geochemistry, and geophysics need to be assessed by additional surface work and eventual drilling
Alteration
Alteration at JPL consists of quartz veins, iron oxidation, chloritic alteration, and pervasive silicification. It is most notable in fractures, intrusive units, and structural zones. The Campito and Poleta formations remain largely unaltered. Chlorite generally occurs with dikes and sills in the eastern portion of the project area.
Quartz veins are clustered on the eastern and western sides of the Project area within the structural zones. Quartz veins at JPL can be white milky quartz with no iron oxidation. When sampled, these veins did not carry gold. Quartz also occurs as vuggy and pitted quartz fracture fill with strong iron oxidation. These zones typically have euhedral quartz crystals within the vugs. These quartz veins do carry mineralization. The quartz veining is mostly found in the Campito and Poleta Formations.
The quartz veins generally have moderate to strong iron oxidation, and iron oxidation occurs along fractures and structures. The iron oxidation is likely after disseminated pyrite. Typically, the gold values are directly correlative with the iron oxidized quartz veining.
Pervasive silicification is common within the fracture zones and structural zones; and the Jurassic dikes and sills often show moderate pervasive silicification. Mappable structural zones host quartz veins and are typically pervasively silicified in proximity to the structure.
Deposit Type
At this early point, the exact nature of the mineralization at JPL is not clear. Geologic setting and geochemistry suggest an intrusive related gold system. These systems can manifest with quite different styles of mineralization depending on the local host rock, distance from the causative pluton, and structural components driving fluid pathways.
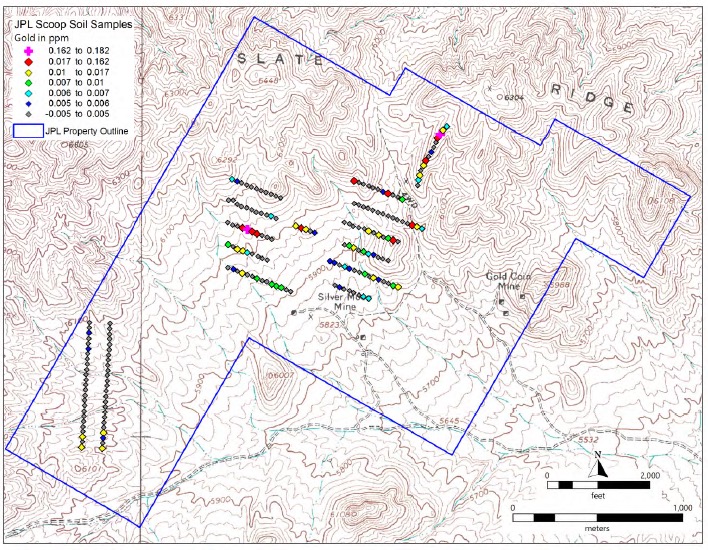
Figure. 6 – JPL Project – Gold in Rock Chip Samples (ppm)
detection (<5 ppb) to 182 ppb
Silver values overall were low, ranging from <0.5 ppm to 5 ppm; arsenic showed the largest relative range with values from <5 to 319 ppm. Areas of coincident (Au, Ag, Sb, As) anomalies are found along the northeastern soil line, and a swath in the west central lines. Most of these clusters are along mapped structures or structural trends (Figure. 4).
As well, 195 scoop “soil” samples were collected on the property. In this technique, a small scoop of the surface soils is collected approximately every six feet and put into a bag for the sample length of 100 feet and then analyzed like a rock sample. The sample lines were laid out to cross suspected structural trends identified during mapping and rock chip sampling. Gold values ranged from less than
Figure. 6 – JPL Project – Gold in Rock Chip Samples (ppm)
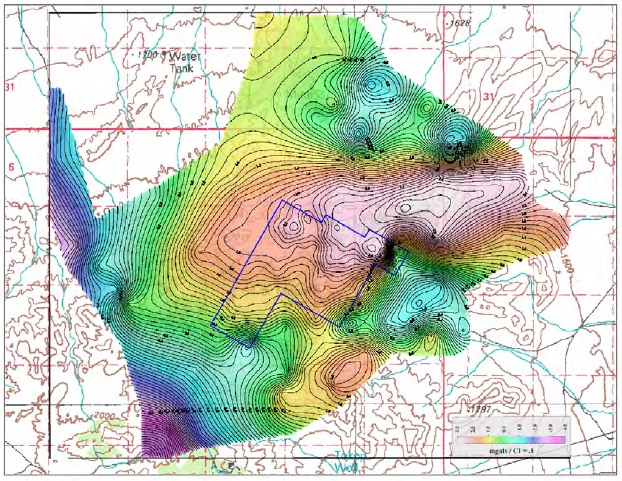
A geophysical consultant (Jim Wright of Spring Creek, Nevada) was engaged to design and interpret a program of gravity and ground magnetics. The survey area was laid out to extend beyond the initial claims to provide sufficient data to identify major geologic features (Figure. 5). McGee Geophysical was contracted to do the field data collection and initial data processing. Gravity readings were collected from 211 stations on a 200 metre offset grid pattern. These readings were merged with additional readings taken at 500 – 1000 metre intervals along public roads in the area to place the detailed grid into a district scale perspective.
Wright (2021) calculated several components of the gravity data to aid in interpretation, where Figure. 4 depicts the district scale residual gravity.
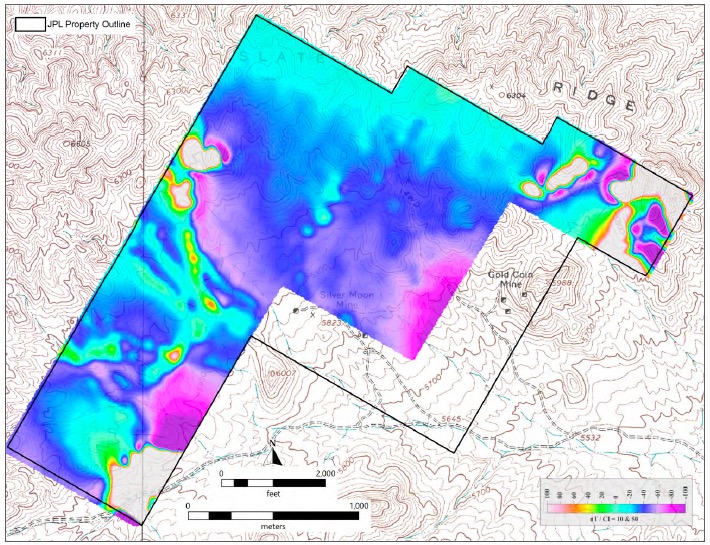
A total of 91.6 line kilometers of magnetic data was collected on lines spaced 50 meters apart in continuous mode at two second spacing (Figure .6).
Figure. 8 – JPL District – Residual Gravity (Wright 2021)
Figure. 9 – JPL Project – Ground Magnetic data – reduced to pole
To date, Starmet has not drilled on the JPL property. The drilling conducted by AGR and Atlas Precious is the only known drilling on the property (Figure. 6). Trenching by AGR consisted of cutting and sampling sixteen trenches with a total length of 1,361 meters (4,466 ft). Drilling by AGR consisted of six shallow holes with a maximum depth of 80 meters (260 feet) around the Silver Moon Mine. All encountered detectable gold with the best interval being 4.6 meters (15 ft) averaging 0.96 ppm gold. Atlas drilled three holes for a total of 457 meters (1,500 ft) with a maximum depth of 160 meters (525 ft) to evaluate a mercury in soil anomaly. The best interval was 3 meters (10 ft) of 0.32 ppm Au.
Work to date indicates the potential for a significant gold deposit on the property. Previous exploration drilling encountered thin intercepts of gold and silver, that may indicate a mineral system is present. Additional recommended work (as outlined below), can be combined with the existing database to identify prospective areas for additional drilling:
• Additional geological mapping concentrated on defining mineralized structures and alteration patterns; and • Soil sampling and rock geochemistry.